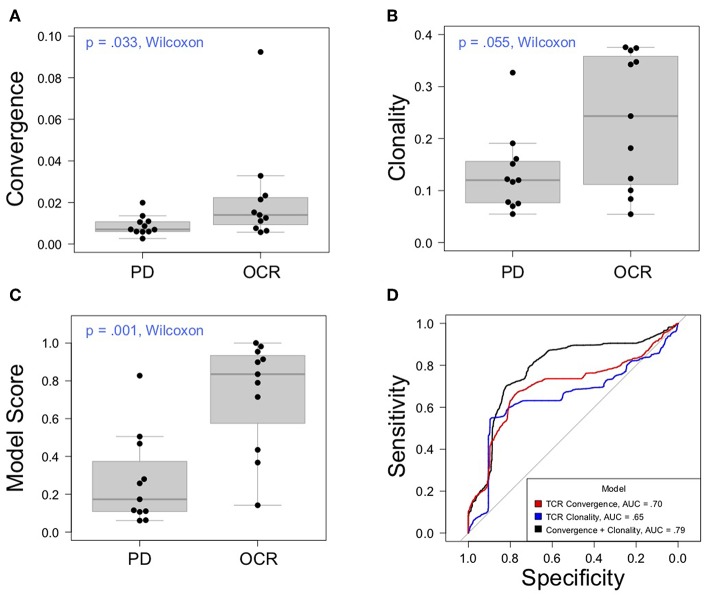
Figure 3.
Association between clinical outcomes and TCR convergence. (A) TCR convergence and (B) clonality for responders (N = 11) and non-responders (N = 11) to CTLA-4 blockade for cancer. TCR clonality is calculated as 1—the normalized Shannon entropy of clone frequencies. Convergent TCR frequency was calculated as described in methods. All cancer types were included in the analysis. (C) Response probability scores from a logistic regression classifier trained using TCR clonality and convergence as features to predict response to immunotherapy. Score indicates likelihood that a sample is a responder. (D) Receiver operator characteristic curves derived from leave-group-out cross validation analysis of models using clonality, convergence, or the combination of clonality and convergence to predict immunotherapy response. ROC curves represent the average model performance following 2,000 random train-test splits, where 75% of the dataset was used to train the model followed by testing on the remaining 25%. The combination of TCR clonality and convergence shows better performance (AUC = 0.89) than models using TCR convergence and clonality alone (AUC of 0.70 and 0.65, respectively).

