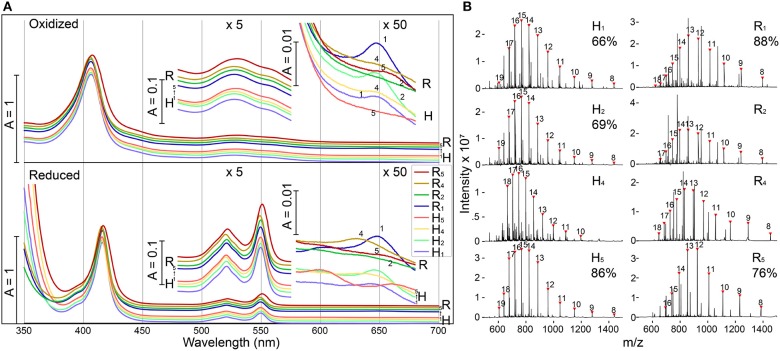
Figure 2.
Modified shell proteins contain redox-active hemes (A) UV-Vis spectra of purified shell-cytochromes under oxidizing (upper) or reducing (lower) conditions. Green region and red region also plotted with 5x or 50x amplification. (B) Protein mass spectrometry of purified shell-cytochromes. Expected holo-protein are marked with charge states in red triangles. The percentage of holo-protein in all full-length protein are labeled under the sample name (If available, see section Methods). See Supplementary Figure 3 for unlabeled peaks.

