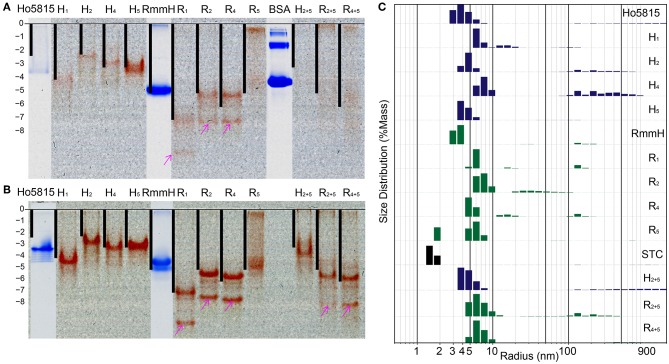
Figure 3.
Shell-cytochrome retain capacity to oligomerize. (A) Native PAGE (B) native PAGE with 4 M urea show the mobility of H-/R-variants and their corresponding WT. Lanes of H-/R-variants show as un-stained and the red is the natural color of hemes. WT Ho-5815 and RmmH as well as molecule weight marker BSA were overlapped from the same gel after staining. The calculated net charge for shell-cytochrome monomers are plotted as black bars. The “0” charge is aligned to the beginning of resolving gel and the vertical length is stretched to allow RmmH to align to the gel band. (C) DLS of H-/R-variants compare with corresponding WT and STC. The heights of bars represent the relative mass distribution.

