FIGURE 2.
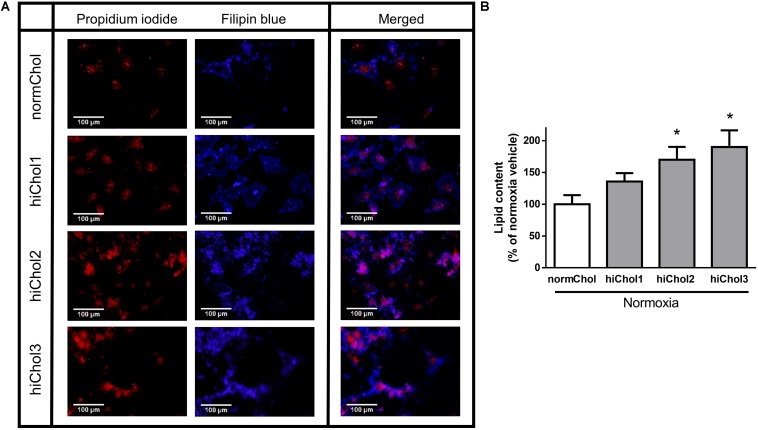
(A) Representative images of membrane cholesterol content in neonatal cardiac myocytes after cholesterol supplementation (hiChol1, hiChol2, hiChol3) measured with Filipin staining (for cholesterol content) and propidium iodide staining (for total cell count). (B) Membrane cholesterol levels of neonatal cardiac myocytes evaluated (ImageJ software) after cultivation with different supplements (hiChol1, hiChol2, hiChol3). Data are expressed as mean ± SEM compared to normoxia vehicle control group (100%). ∗p < 0.05 vs. normoxia vehicle (one-way ANOVA, Tukey’s post hoc), n = 20–23.

