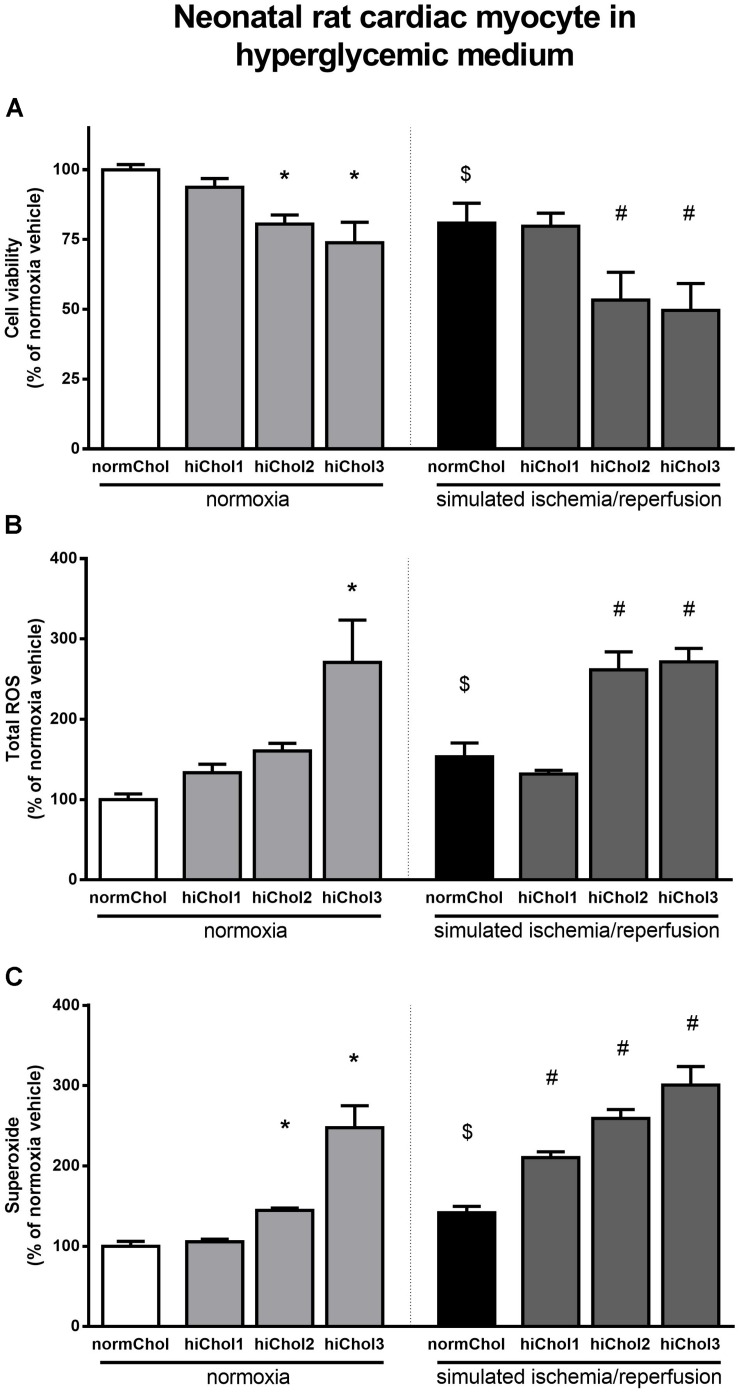
FIGURE 4.
Neonatal rat cardiac myocyte cells cultured in hyperglycemic medium with/without hiChol1-3 supplements. Viability (A) was measured with calcein AM staining in normoxia or after SI/R injury. Total ROS (B) and superoxide (C) level were also measured in normoxia or after SI/R. Data are expressed as mean ± SEM, in comparison to normoxia vehicle control group (100%). $p < 0.05 normoxia vehicle vs. SI/R vehicle (t-test); ∗p < 0.05 vs. normoxia vehicle (one-way ANOVA, LSD post hoc); #p < 0.05 vs. SI/R vehicle (one-way ANOVA, LSD post hoc); n = 6–12.

