Figure 5.
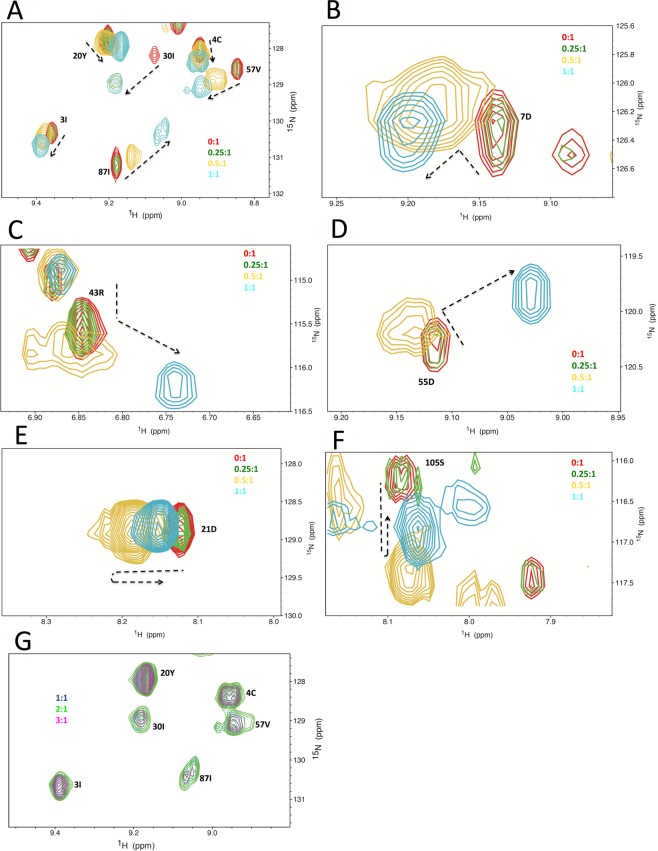
NMR chemical shift perturbation analyses of the interaction between Fpr C151Stop D135N and HJ8/5 in solution. Titration of HJ DNA into Fpr dimer at their molar ratios of 0:1 (red), 0.25:1 (green), 0.5:1 (orange) and 1:1 (cyan). (A) A region of the 1H-15N TROSY-HSQC spectra with residues showing linear chemical changes. (B–F) Different regions of the spectra with residues that showed nonlinear trajectories of peak shifts. The paths of peak shifts are indicated by dotted arrows. (G) Same region as in A, showing further titration of HJ DNA into Fpr dimer at ratios of 1:1 (blue), 2:1 (green), 3:1(magenta).

