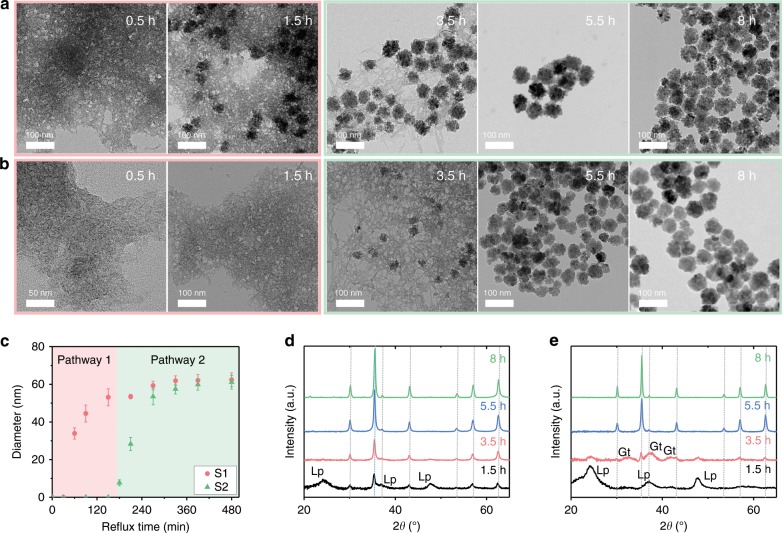
Fig. 2. Crystallization of Fe3O4 mesocrystals in S1 and S2 during refluxing.
a, b TEM images of a S1 and b S2 after 0.5, 1.5, 3.5, 5.5, and 8 h of refluxing. c Growth of Fe3O4 mesocrystals in S1 and S2. Red (pathway 1) and green (pathway 2) indicate growth from different ferric (oxyhydr)oxide polymorphs. Diameters are mean values of the Gaussian function measured from n > 200 mesocrystals in TEM images; error bars indicate standard deviations. d, e XRD patterns of d S1 and e S2. Lepidocrocite (Lp), goethite (Gt), and magnetite (Mt) are indexed using ICDD no. 00-044-1415, 00-029-0713, and 01-086-1344 (gray dotted line), respectively.

