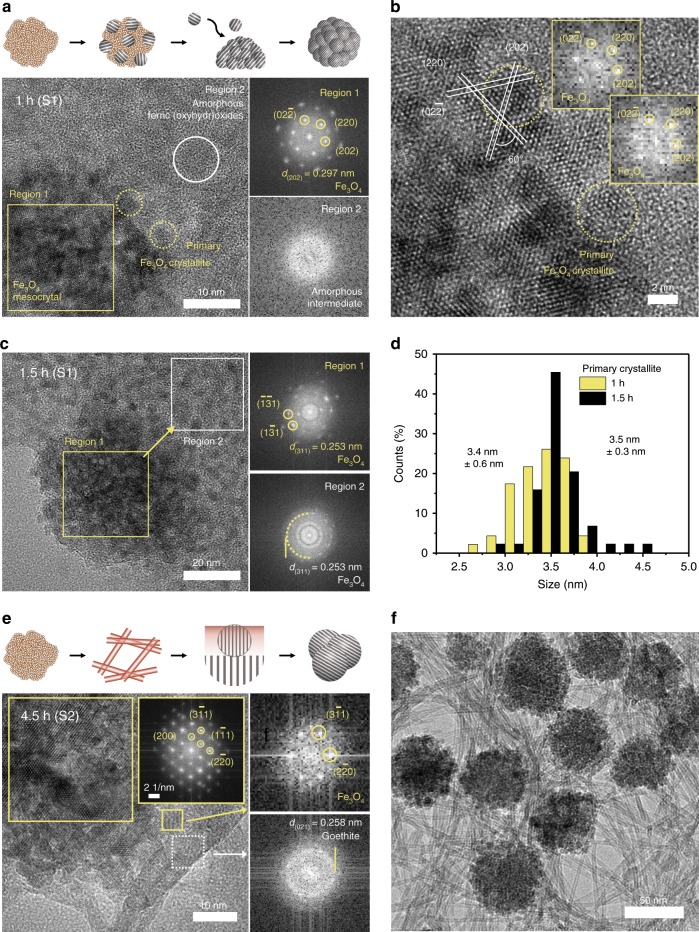
Fig. 3. Microstructural analysis of crystallization pathways.
a TEM analysis of Fe3O4 mesocrystals of S1 after refluxing for 1 h. b HRTEM image showing FFT images of primary crystallites attached to the surface of mesocrystals in S1 after refluxing for 1 h. c TEM images and FFT patterns of S1 after refluxing for 1.5 h. The Regions for FFT patterns are indicated in each bright field image of a–c. The phase and corresponding d-spacing of the FFT patterns are denoted in each panel. d Sizes of primary crystallites after 1 and 1.5 h of refluxing. A Gaussian distribution is obtained from the measured sizes of n = 50 mesocrystals. e HRTEM image and FFT patterns of S2 after refluxing for 4.5 h. The FFT pattern shows d-spacing of spots derived from the magnetite and goethite closest to the center. f Bright-field image of S2 after refluxing for 4.5 h.

