
Figure 1.
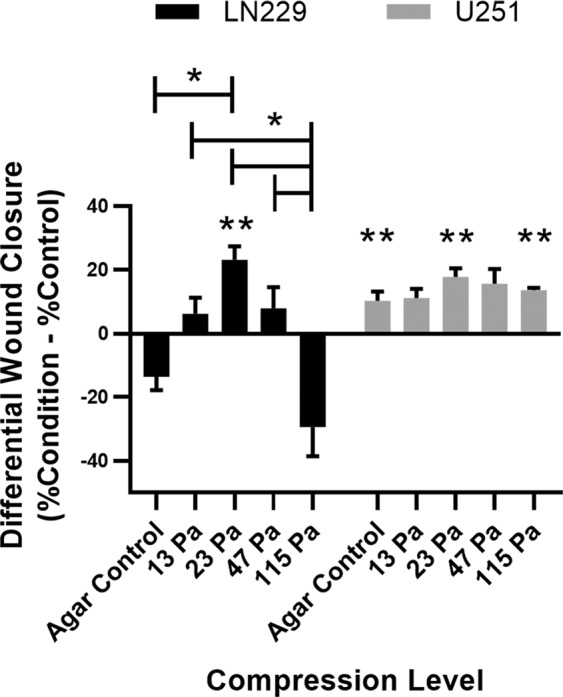
Collective cell migration reaches a maximum at 23 Pa CSS in LN229 and U251 cells. Differential wound closure: the difference of each compression level (agar control, 13 Pa, 23 Pa, 47 Pa, and 115 Pa) from its corresponding experimental control. Levels connected by a star (*) are statistically significant at α = 0.05. Conditions marked with two stars (**) are statistically significant compared to their control for each cell type at α = 0.01 after Bonferroni correction.