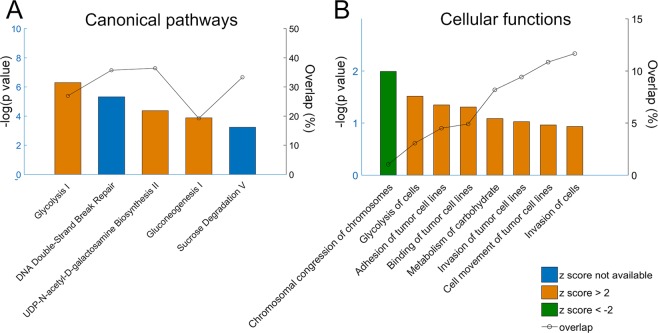
Figure 3.
IPA analysis of canonical pathways and cellular functions at low CSS (23 Pa). (A) Top canonical pathways ranked by -log(p value). Overlap, indicated on the right axis, is calculated as the number of differentially regulated genes in the pathway over the number of total genes in that pathway. (B) Top molecular and cellular functions ranked by -log(p value). Overlap, shown on the right axis, is the number of differentially regulated genes related to that function over total number of differentially expressed genes. Z scores higher than 2 indicate pathway activation/ cell function increase, z scores lower than -2 indicate pathway suppression/ cell function decrease.

