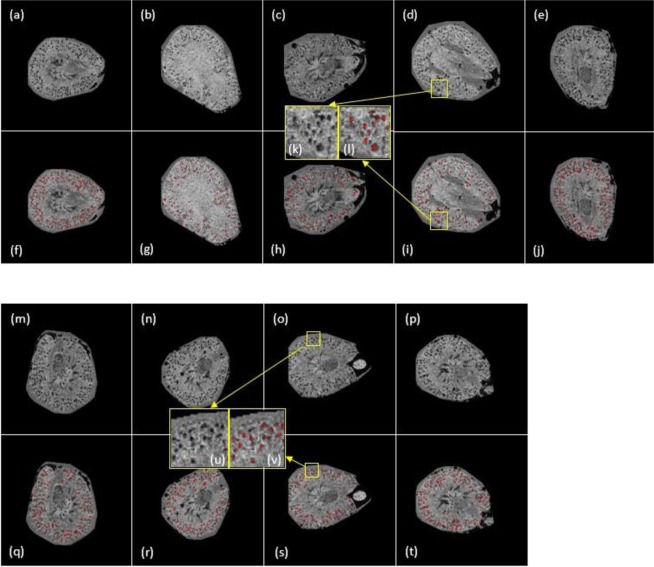
Figure 8.
(a) Glomerular segmentation results from 3D MR images of mouse kidneys (selected slices presented). (a–e) One slice for the AKI group. (f–j) Identified glomeruli are marked in red. (k) is the zoom-in region of (d) while (l) is the segmentation result of (k). (b) Glomerular segmentation results from 3D MR images of mouse kidneys (selected slices presented). (m–p) One slice for the control group. (q–t) Identified glomeruli are marked in red. (u) is the zoom-in region of (o) while (v) is the segmentation results of (u).

