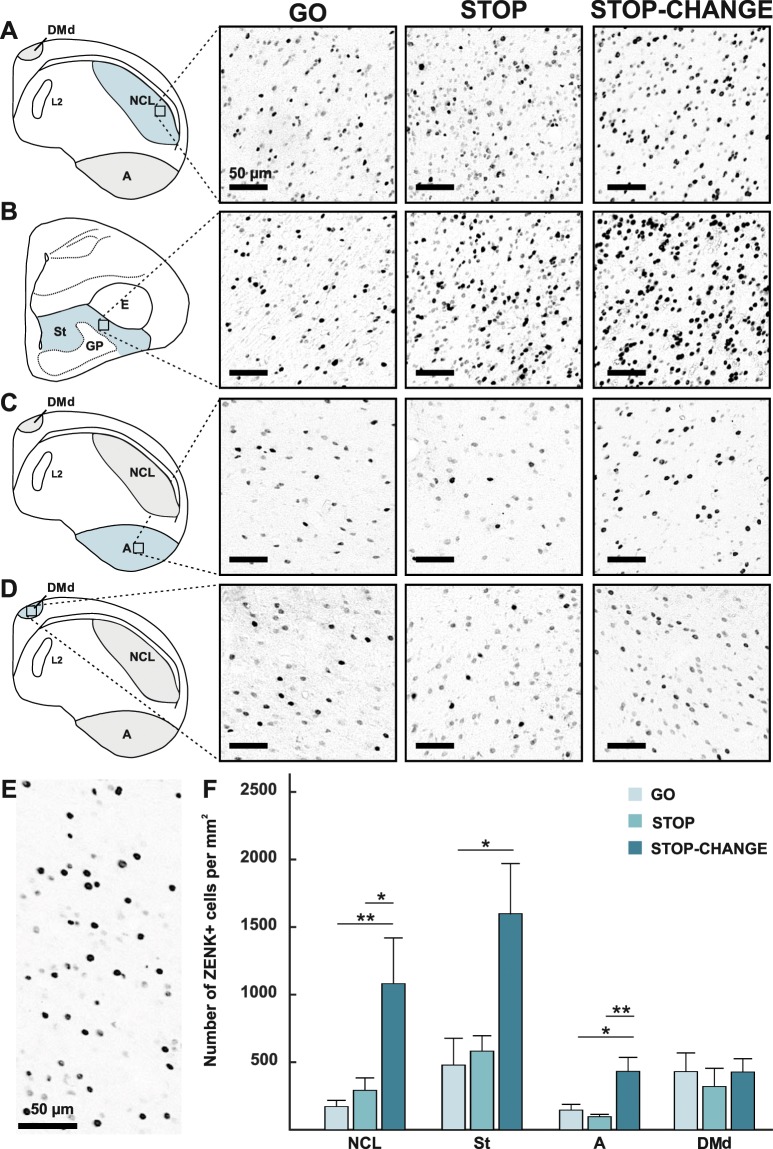
Figure 2.
ZENK expression of all areas in the GO, STOP and STOP-CHANGE group. Schematic drawings of the (A) NCL, (B) striatum, (C) arcopallium and (D) dorsal portion of the dorsomedial hippocampus (DMd). The area of interest is highlighted in blue. The photographic images depict ZENK expression in the GO, STOP and STOP-CHANGE group in the outlined area. (E) Image of ZENK positive neurons under higher magnification, only the nuclei of the neurons are stained indicating antibody specificity. (F) Quantitative analysis of ZENK expression in NCL, striatum, arcopallium and DMd across all three groups (GO group: light blue, STOP group: darker blue, STOP-CHANGE group: dark blue). ZENK expression was significantly increased in NCL, arcopallium and striatum in the STOP-CHANGE group compared to the GO group. Furthermore, in the NCL and arcopallium ZENK expression was significantly increased in the STOP-CHANGE group compared to the STOP group. In the control area DMd no differences were found between the conditions. The error bars represent the standard error of the mean (SEM). Abbreviations: A: arcopallium; DMd: the dorsal part of the dorsomedial hippocampus, E: entopallium; GP: globus pallidus; NCL: nidopallium caudolaterale; St: striatum *p < 0.05, **p < 0.01. All scale bars represent 50 µm.

