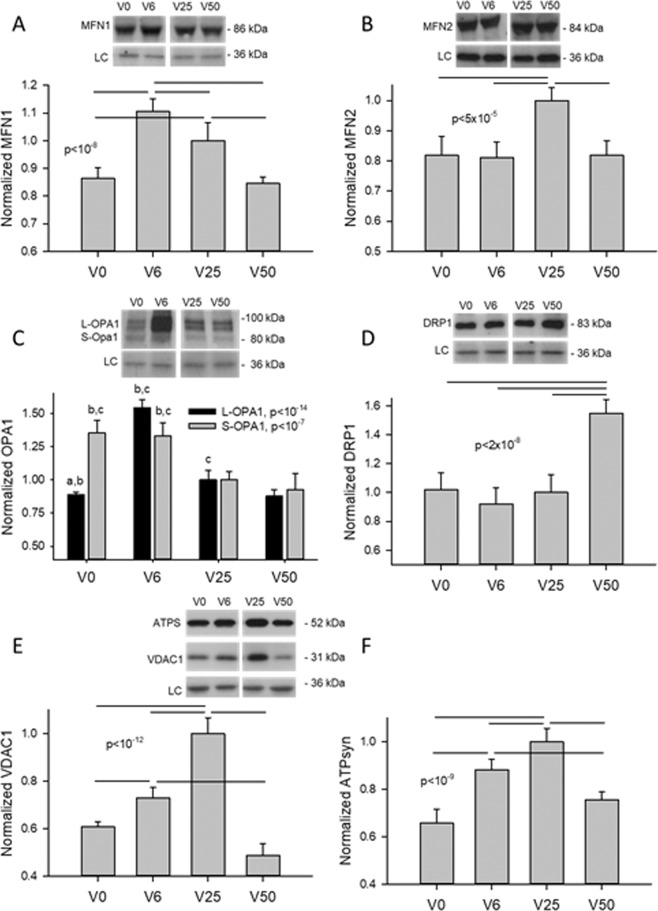
Figure 5.
Example western blots and statistical analyses of mitofusins (MFN1 and MFN2), OPA1, DRP1, VDAC1 and β subunit of the ATP synthase as a function of strain variability (V0, V6, V25, and V50). GAPDH was used as loading controls. Data are expressed as means and SDs. Bars above the data represent statistically significant differences. In panel C, the letters a, b and c represent statistically significant differences compared to V6, V25 and V50, respectively. LC: loading control.

