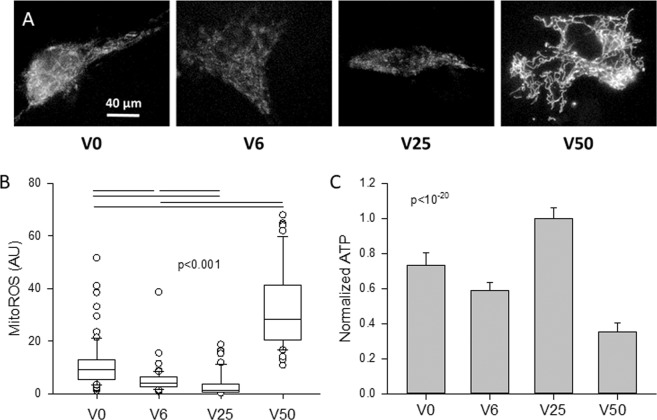
Figure 7.
Example images (A) and statistics (B) of mitochondrial ROS levels after VSMCs were stretched with V0, V6, V25 or V50 and labeled with MitoSOX™ Red mitochondrial superoxide indicator. Approximately 50 cells per group were included in the statistics. The medians are statistically different between all conditions. (C) Means and SDs of total ATP normalized to unity under V25. All conditions are statistically significantly different.

