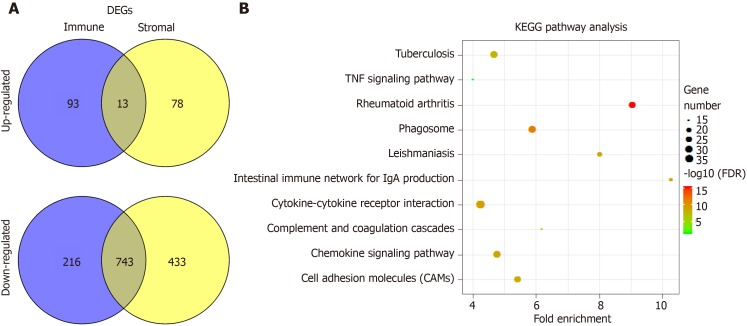
Figure 3.
Comparison of gene expression profile with immune scores and stromal scores of hepatocellular carcinoma in the Cancer Genome Atlas database dataset. A: Venn diagrams showing the number of commonly upregulated or downregulated differentially expressed genes (DEGs) in stromal and immune score groups; B: Kyoto encyclopedia of genes and genomes (KEGG) analysis of DEGs, top 10 GO terms were displayed. False discovery rate of KEGG analysis was acquired from the database for annotation, visualization and integrated discovery functional annotation tool. DEGs: Differentially expressed genes; TNF: Tumor necrosis factor; KEGG: Kyoto encyclopedia of genes and genomes; DAVID: Database for annotation, visualization and integrated discovery.

