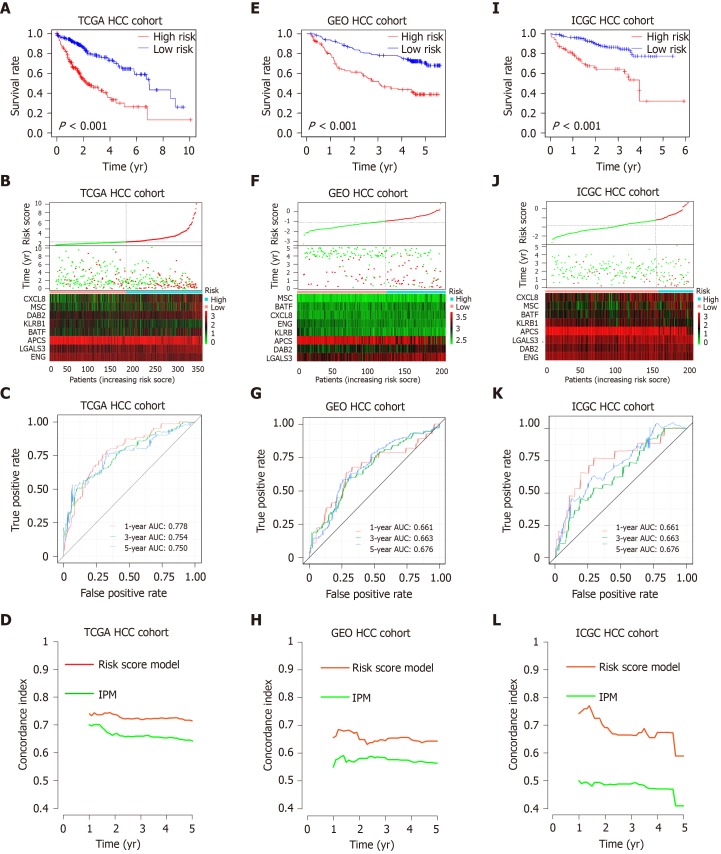
Figure 4.
Prognostic analysis of the risk score model. A-C: Kaplan-Meier survival, risk score and time-dependent receiver operating characteristic (ROC) curves of the risk score model for the Cancer Genome Atlas database (TCGA) hepatocellular carcinoma (HCC) cohort; E-G: Kaplan-Meier survival, risk score and time-dependent ROC curves of the risk score model for the Gene Expression Omnibus databases (GEO) HCC cohort; I-K: Kaplan-Meier survival, risk score and time-dependent ROC curves of the risk score model for the International Cancer Genome Consortium database (ICGC) HCC cohort. A, E and I: OS was significantly higher in the low-risk score group than in the high-risk score group; B, F and J: Relationship between the risk score (upper) and the expression of eight prognostic immune genes (lower) is shown; C, G and K: Time-dependent ROC curve analysis of the risk score model; D, H and L: The concordance index (C-index) was used to evaluate prognostic performance for survival prediction. Performance was compared between the risk score model and immune prognostic model by calculating the C-index in the TCGA, GEO and ICGC HCC cohorts. TCGA: The Cancer Genome Atlas database; GEO: Gene Expression Omnibus databases; ICGC: International Cancer Genome Consortium database; IPM: Immune prognostic model; HCC: Hepatocellular carcinoma.

