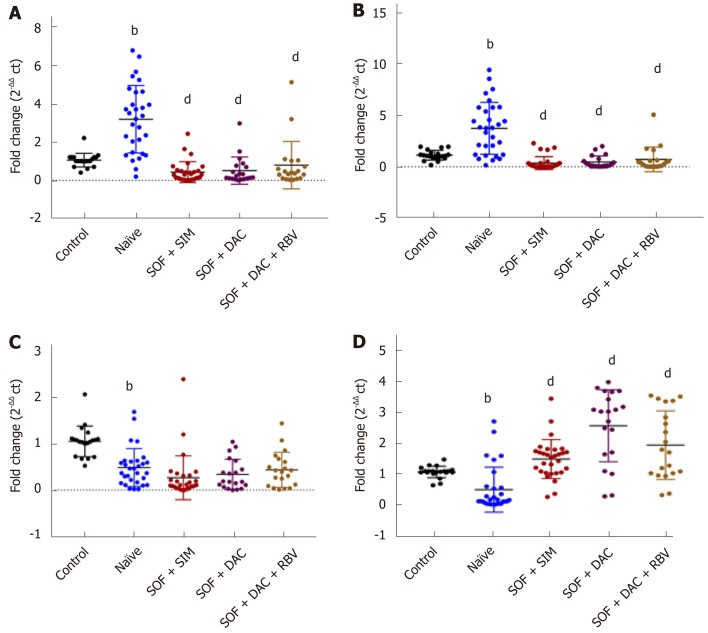
Figure 1.
Serum expression levels of lncRNAs and mRNA in healthy controls, hepatitis C virus naïve patients and hepatitis C virus treated patients with different treatment regimens. A: LncRNA GAS5; B: LncRNA BISPR; C: LncRNA HEIH; D: mRNA BST2. bP < 0.01, vs control group; dP < 0.01, vs naïve group; Data were analyzed by On e-way ANOVA test followed by Tukey HSD multiple comparison test.

