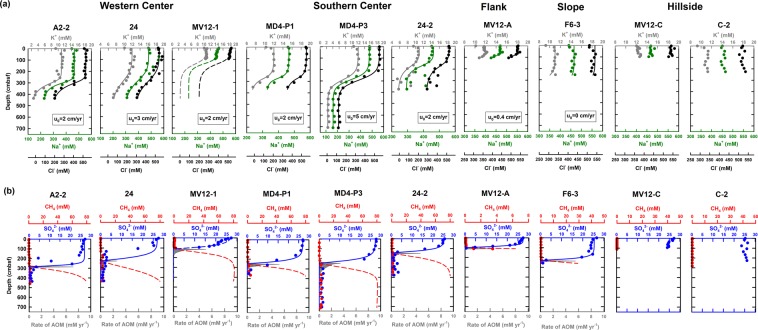
Figure 2.
Concentration depth profiles and results of reactive transport modeling. (a) Chloride (in black), sodium (in green), and potassium (in gray) concentration depth profiles at ten sites investigated in this and previous studies (for sites MV12-A)22. The solid lines represent the best fit of the modeled results. The lower boundary conditions at site MV12-1 (in dashed line) were assumed to be the same as those at site A2-2. The modeled upward velocity was also provided. (b) Modeled results for sulfate (blue solid line) and methane (red dashed line) depth profiles and AOM rates (RAOM; gray area) at eight sites.

