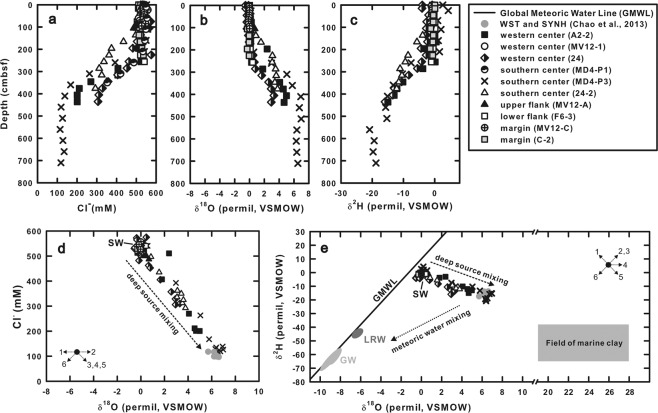
Figure 4.
(a–c) Profiles of chloride concentrations and δ18O and δ2H values. (d,e): Plots of δ18O value versus chloride concentration and δ18O versus δ2H values. Gray dots are data from terrestrial mud volcanoes for comparison74. The black line in (e) indicates the Global Meteoric Water Line (GMWL; δ2H = 8 × δ18O + 10). Areas denote with “LRW” and “GW” in (e) marked the ranges of isotopic compositions for local meteoric water and groundwater from adjacent onshore areas, respectively75; gray square area represents the δ18O and δ2H values of marine clay48–51. Arrows marked with numbers in (d) and (e) represent processes potentially occurring at the source depth, and their directions denote the trends associated with the processes8: 1: volcanic ash alteration at temperatures lower than 300 oC; 2: volcanic ash alteration at temperatures higher than 300 oC; 3: gas hydrate dissociation; 4: biogenic opal recrystallization; 5: clay mineral dehydration; 6: meteoric water input.

