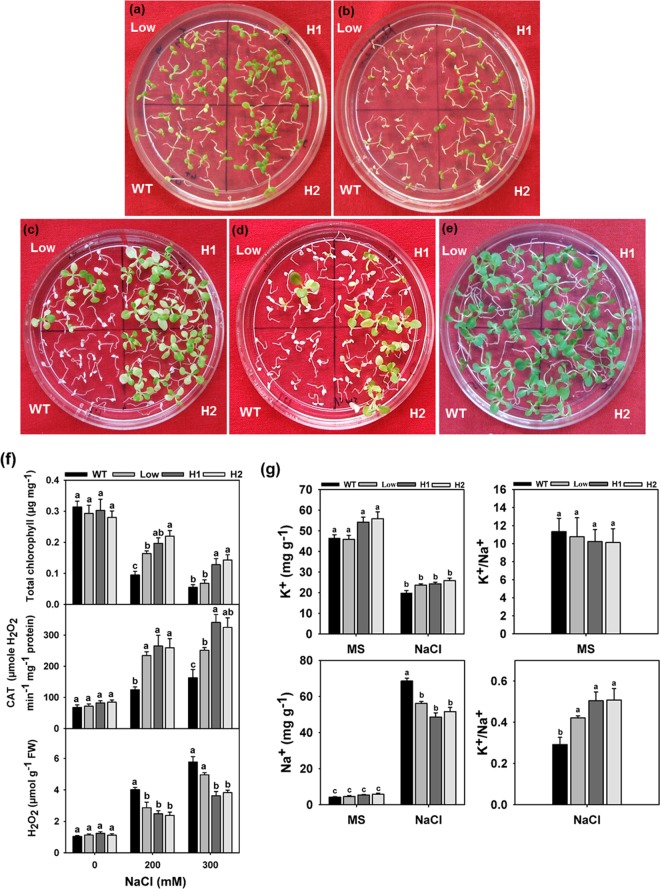
Figure 4.
Effect of NaCl stress on seedlings growth. The 10 d old seedlings were treated with NaCl. Clear differences were observed between WT and transgenic seedlings after 10 d of 200 mM (a) and 7 d of 300 mM (b) NaCl treatment. Seedlings on NaCl-free medium; recovery (for 15 d) after 6 d treatment with 200 mM and 300 mM NaCl (c,d). (e) Unstressed seedlings were regularly sub-cultured along with the NaCl-treated seedlings. (f) Total chlorophyll content, CAT activity and H2O2 generation was measured after 6 d treatment. Values are means ± SE (n = 3) and each replicate comprises a minimum of 10 seedlings. (g) Measurement of K+ and Na+ content under NaCl treatment after 6 d. The whole seedlings of the WT and transgenic lines were sampled to detect K+ and Na+ contents, and then the ratio of K+ and Na+ was calculated. Values are means ± SE (n = 3), and each replicate comprises minimum 20 seedlings. Different letters indicate significant difference (P ≤ 0.05) with each other. H1 and H2 represent high expression lines whereas Low represents low expression line seedlings.

