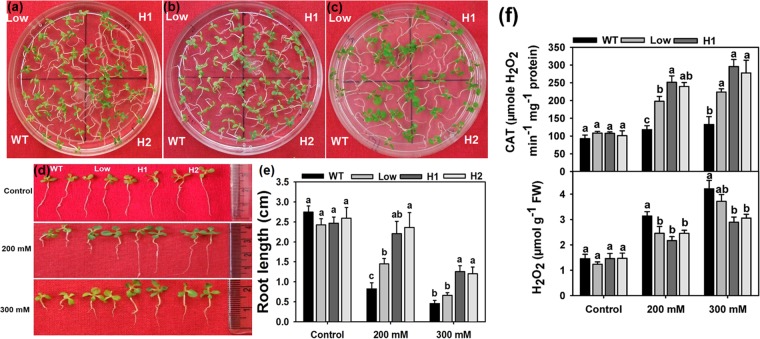
Figure 5.
Effect of osmotic stress on seedling growth. The 10 d old WT and transgenic seedlings were transferred to 200 mM (a) and 300 mM (b) Sorbitol medium for 15 days. (c) Seedlings not subjected to stress. (d) Phenotypic difference in the growth of seedlings after 15 d of treatment. (e) Graphical representation of root length measurements. Values are means ± SE (n = 3), and each replicate comprises 15 seedlings. (f) Measurement of CAT activity and H2O2 content after 10 d of stress treatment. Values are means ± SE (n = 3), and each replicate comprises minimum 10 seedlings. Different letters indicate significant difference (P ≤ 0.05) between each other. H1 and H2 represent high expression lines whereas Low represents low expression line seedlings.

