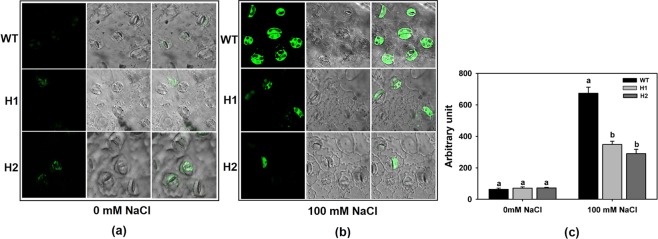
Figure 7.
ROS detection in leaf epidermal guard cells using Confocal Microscopy. Fluorescence levels in WT and high expression line plants (H1 and H2) were observed after (a) control and (b) 100 mM NaCl treatments by staining with H2DCFDA. WT samples showed higher ROS accumulation during NaCl stress. Bright field images were also displayed. (c) Quantification of ROS production by using Image-J software. Values are means ± SE (n = 3), and each replicate comprises 100 stomata. Different letters indicate significant difference (P ≤ 0.05) between each other.

