
Figure 8.
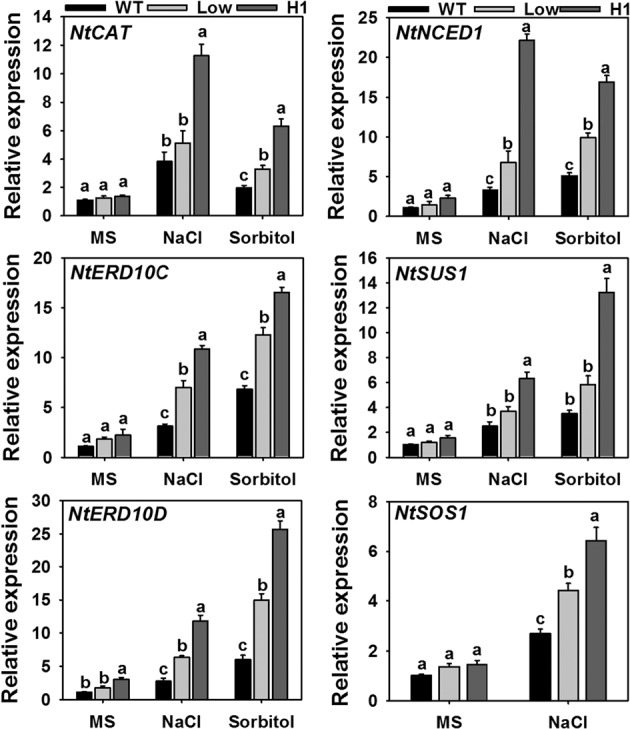
Transcript level analysis of stress-related genes in plants under NaCl and osmotic stress conditions. The 10 d old seedlings of WT and transgenic lines (low and H1) were exposed to NaCl treatment (200 mM NaCl) and osmotic stress treatment (300 mM Sorbitol) for 3 d followed by real time expression analysis of stress related genes. Values are means ± SE (n = 3), and each replicate comprises 5 seedlings. Different letters indicate significant difference (P ≤ 0.05) between each other.