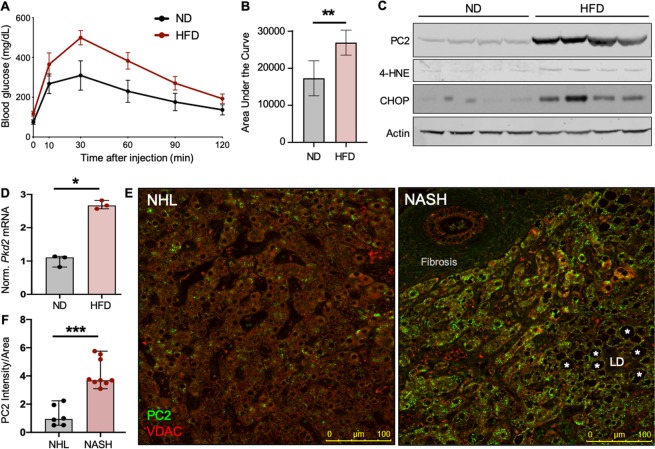
Figure 2.
PC2 levels are increased in livers with NAFLD. (A) Plasma blood glucose levels and (B) quantified area under the curve during glucose tolerance tests of mice fed ND or HFD for 8 weeks. Shown are the mean area under the curve ± SD of 5 mice per group. **p < 0.01 as determined by Mann Whitney U test. (C) Mouse livers from ND- or HFD-fed mice were immunoblotted for PC2, 4-HNE, and CHOP. Each lane represents one biological replicate; sample size n = 4 per group. Full-length blots shown in Fig. S7. (D) Normalized mRNA expression of Pkd2 in livers of mice fed ND or HFD for 14 months. Gapdh used as internal control. Sample size n = 3 biological replicates per group. *p < 0.05 as determined by Mann Whitney U test. Data presented as median with range. (E) Normal human livers (NHL) or livers with non-alcoholic steatohepatitis (NASH) were stained for PC2 (green) and VDAC (red). Scale bar, 100 μm. LD = lipid droplet. Asterisks depict lipid accumulation within the liver. (F) PC2 intensity normalized to cell area was quantified in human NHK and NASH livers. ***p < 0.001 as determined Mann Whitney U test. Quantification is of 5 images per sample; sample number NHL n = 6, NASH n = 9.

