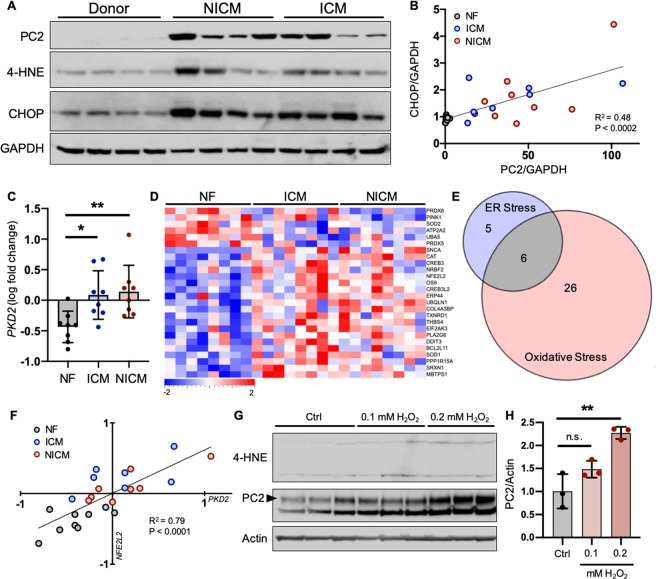
Figure 3.
PC2 expression is up-regulated with stress and correlates with ISR pathway activation. (A) Left ventricular (LV) tissue samples from non-failing (NF) human hearts and from heart failure patients with non-ischemic cardiomyopathy (NICM) or ischemic cardiomyopathy (ICM) were immunoblotted for PC2, 4-HNE, and CHOP. Each lane represents one biological replicate; data shown are representative of n = 8 for each condition. Full-length blots shown in Fig. S8. (B) Normalized protein expression of PC2 was plotted against its corresponding normalized CHOP expression. Linear regression analysis demonstrated that PC2 levels significantly correlated with stress induction as measured by CHOP abundance. (C) RNA-Seq RPKM values from human NF LV samples and in heart failure patients diagnosed with ICM or NICM were log2 transformed and their fold change determined. PKD2 transcripts were increased in the LV of ICM and NICM, compared to NF, hearts. *p < 0.05 and **p < 0.01 as determined by one-way ANOVA. Data presented as mean ± SD. (D) Curated lists of ER- and oxidative-stress associated genes were used to generate a heat map of stress-related gene expression in NF, ICM, and NICM samples. All genes shown exhibited significant differential expression (p < 0.05) amongst groups. A color legend is pictured with a scale from −2 to +2-fold change. (E) Genes that were overlapping between MetaCore and IPA-curated lists were used to generate ‘overlapping’ ER and ‘overlapping’ oxidative stress lists. These lists were cross-referenced, and 6 genes appeared in both lists, which were classified as ISR pathway genes. (F) Linear regression analysis demonstrated that one of the two ISR genes differentially expressed amongst NF, ICM, and NICM samples, NFE2L2, significantly correlated with PKD2 expression. (G) Human iPSC-CMs were treated with increasing concentrations of H2O2 for 2 hours and immunoblotted for 4-HNE and PC2. Each lane represents one independent experiment; sample size n = 3 independent experiments per group. Full-length blots shown in Fig. S9. (H) Quantification of PC2 abundance in untreated (Ctrl) versus H2O2-treated iPSC-CMs. **p < 0.01 as determined by one-way ANOVA. Data presented as mean ± SD.

