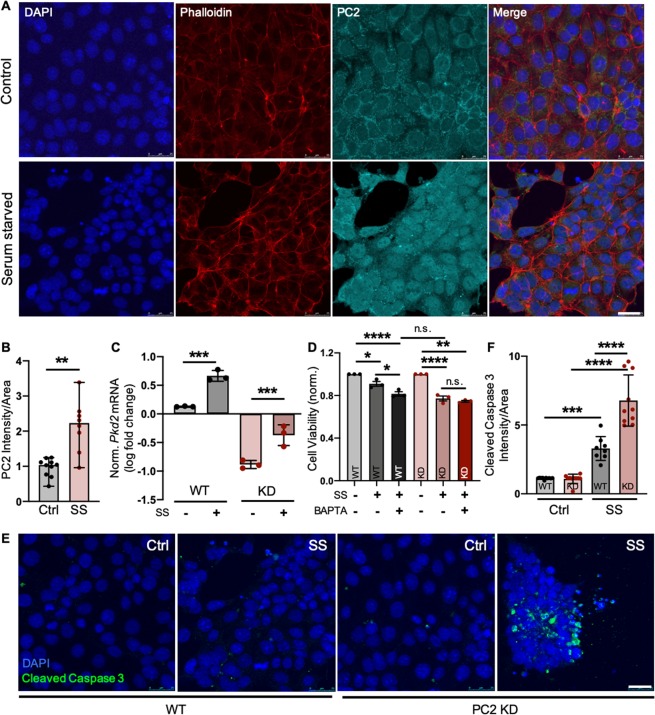
Figure 5.
PC2 protects against stress-induced cell death. (A) Kidney epithelial LLC-PK1 cells were grown in normal culture medium (Control) or base medium not supplemented with FBS (Serum Starved, SS) for 24 hours, then stained for DAPI (blue), phalloidin (red), and PC2 (cyan). Scale bar, 25 μm. (B) PC2 intensity normalized to cell area was quantified in control and serum-starved (SS) LLC-PK1 cells. **p < 0.01 as determined by Mann Whitney U test. Quantification is of 5 images per sample; n = 10 samples per group. Data presented as median with range. (C) Fold change mRNA expression of Pkd2 in serum-starved WT, and control and serum-starved PC2 KD cells compared to WT control cells. Actin used as internal control. n = 3 independent experiments per group. ***p < 0.001 as determined by one-way ANOVA. Data presented as mean ± SD. (D) Viability of WT and PC2 KD (KD) cells was tested via CellTiter-Glo assay under normal (Ctrl) and stressed (SS) conditions with or without 24-hour co-treatment of 100 nM BAPTA-AM (BAPTA). *p < 0.05, **p < 0.01, and ****p < 0.0001 as determined by one-way ANOVA. n = 3 independent experiments per group with 10 replicates per experiment. Data presented as mean ± SD. (E) WT and PC2 KD cells were grown in normal culture medium (Ctrl) or serum starved (SS) for 24 hours, then stained for DAPI (blue) and cleaved caspase 3 (green). Images shown are representative of 10 control and 10 serum-starved samples from both WT and PC2 KO cell lines. Scale bar, 25 μm. (F) Cleaved caspase 3 intensity normalized to cell area was quantified. ***p < 0.001 and ****p < 0.0001 as determined by one-way ANOVA. Quantification is of 5 images per sample; n = 10 samples per group. Data presented as mean ± SD.

