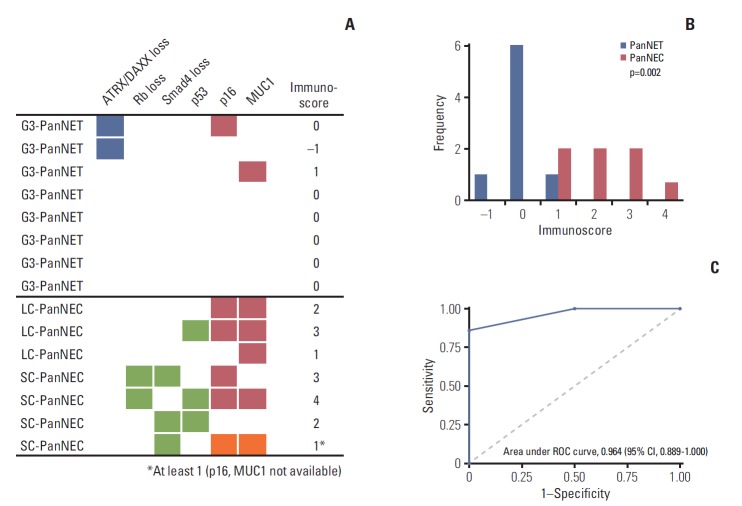
Fig. 5.
(A) Summary of the immunohistochemical stain results. (B) Bar graph summarizing the differences in the immunoscore between G3 pancreatic neuroendocrine tumors (PanNETs) and pancreatic neuroendocrine carcinomas (PanNECs). (C) Receiver operating characteristic (ROC) curve for the immunoscore. LC, large cell; SC, small cell; CI, confidence interval.

