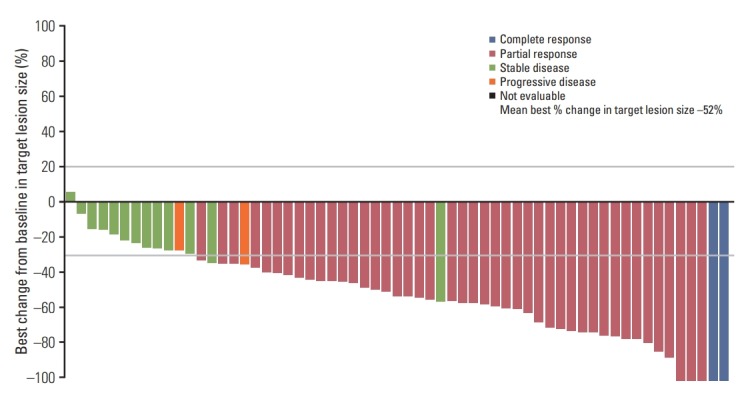
Fig. 1.

Waterfall plot of target lesion size, best percentage change from baseline by blinded independent central review (evaluable-for-response set). Best percentage change in target lesion size is the maximum reduction from baseline or the minimum increase from baseline in the absence of a reduction. Data cutoff November 1, 2016.
