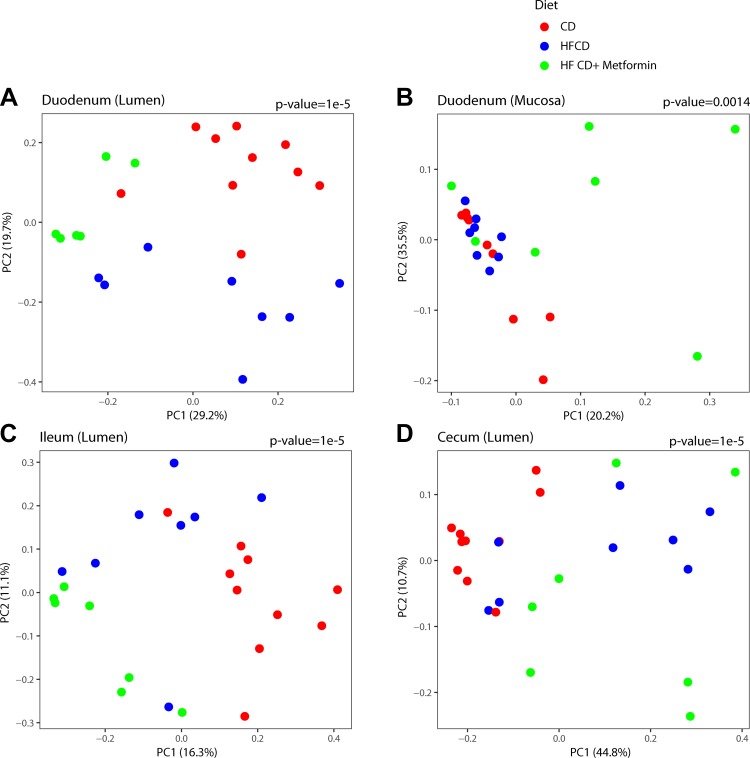
Fig. 1.
Microbiome composition throughout the gastrointestinal tract is altered by a high-fat, high-calorie diet (HFCD) and metformin. Overall microbial composition is represented in principal coordinate analysis plots derived from the square root of the Jensen-Shannon divergence distances. Each symbol represents one mouse, with the color representing the treatment groups across various sites: duodenum (lumen) (A), duodenum (mucosa) (B), ileum (lumen) (C), and cecum (lumen) (D). P value for differences across groups is shown adjusting for sex. CD, control diet; PC, principal coordinate.

