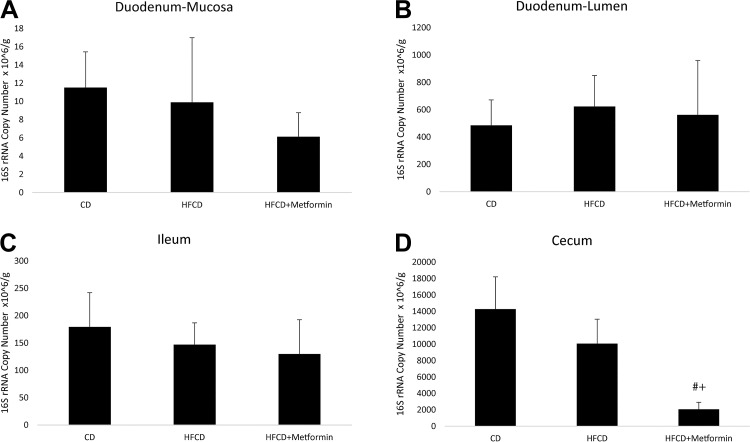
Fig. 3.
Overall bacterial quantity by different regions and different treatment groups: duodenum-mucosa (A), duodenum-lumen (B), ileum (C), and cecum (D). Overall bacterial load as determined by quantitative PCR of the different regions of the gastrointestinal tract. #Significance between control diet (CD) and high-fat, high-calorie diet (HFCD) with metformin; +significance between HFCD and HFCD with metformin.

