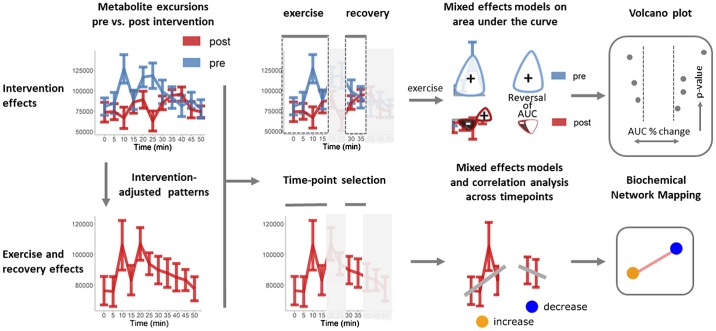
Fig. 1.
Visual representation of the data analysis workflow. Data pretreatment and analysis workflows were implemented to identify 1) exercise and recovery and 2) intervention-associated effects in metabolite excursion patterns. The magnitude and direction of the time-dependent effects were summarized based on Spearman correlations between metabolite peak intensities and time for intervention-adjusted data. Intervention effects were summarized based on area under the curve (AUC) for exercise data and change over 30–35 min for recovery.

