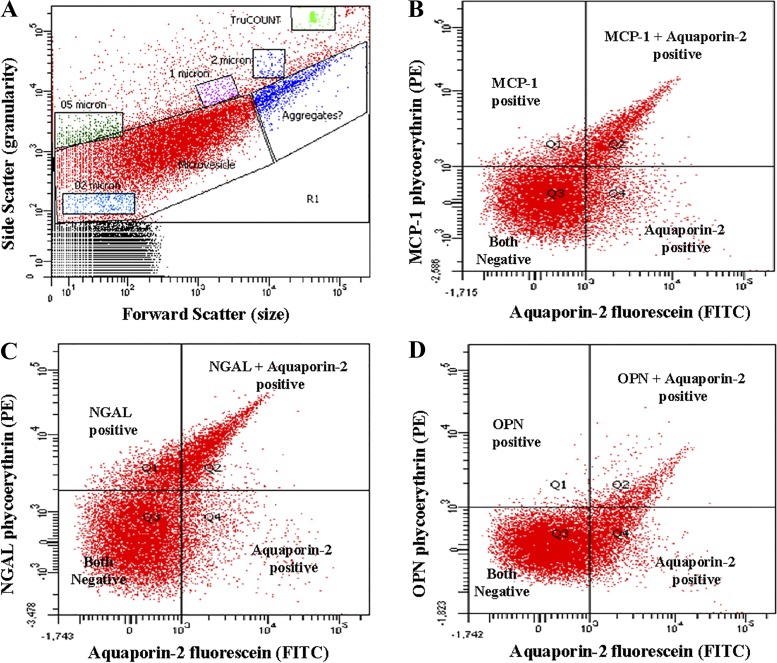
Fig. 1.
Example scatterplots (A) and fluorescence dot (quadrant) plots (B–D) from FACSCanto flow cytometry. Fluorescent dot plots [quadrant derived from the microvesicle gate (contain 0.2 to 1 μm size vesicles) of A, which contains a substantial portion of extracellular vesicles] showing fluorophore spectra separates. B: monocyte chemoattractant protein (MCP)-1 plus aquaporin-2 (a specific marker of collecting duct cell-derived extracellular vesicles). C: neutrophil gelatinase-associated protein (NGAL) plus aquaporin-2. D: osteopontin plus aquaporin-2. A similar pattern of scatterplot and fluorescence dot was observed with other marker combinations in all study participants.

