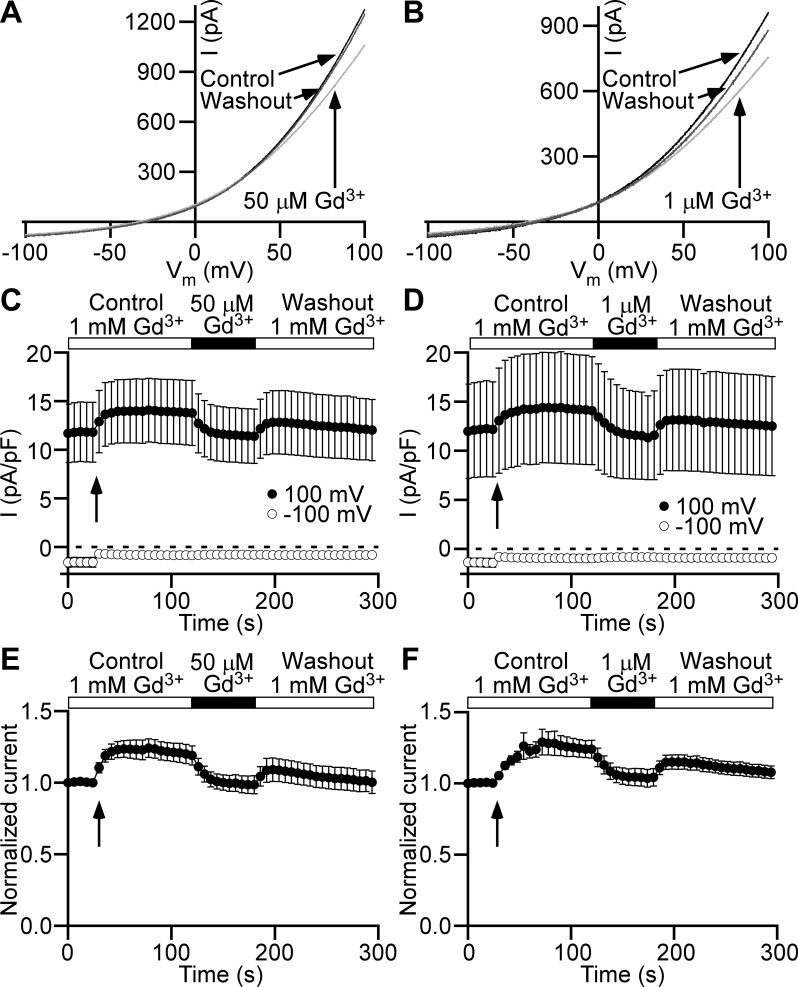
Fig. 8.
Extracellular Gd3+ increases Cl− current in detrusor smooth muscle cells. A and B: representative current (I)-membrane potential (Vm) relationships obtained from 1-s ramp stimuli from −100 to +100 mV show fully reversible current decrease when extracellular 1 mM Gd3+ concentration (Control, black trace) was reduced to 50 µM (light gray trace in A) or 1 µM (light gray trace in B). Washout of 50 µM Gd3+ (A) or 1 µM Gd3+ (B) traces (Washout, dark gray trace) are shown for time points of recovery equal to the duration of applications of bath solutions with reduced Gd3+ concentrations. Arrows link traces with conditions under which they were obtained. C and D: Cl− current time courses measured at +100 mV (●) and −100 mV (○). Closed horizontal bars show durations of a local perfusion with a bath solution containing Gd3+ at concentrations 50 µM (C) or 1 µM (D). Gd3+ concentration at control conditions (Control) and recovery (Washout) was equal to 1 mM. Arrows indicate the beginning of the local perfusion. E and F: Cl− current time courses normalized to the first time point measured at +100 mV show statistically significant Cl− current decrease upon bath Gd3+ concentration reduction from 1 mM to 50 µM (n = 9 cells, N = 3 guinea pigs, P < 0.05, paired Student’s t test) (E) or 1 µM (n = 7, N = 3, P < 0.05, paired Student’s t test) (F). All other symbols and marks in E and F have the identical meaning as in C and D, respectively.

