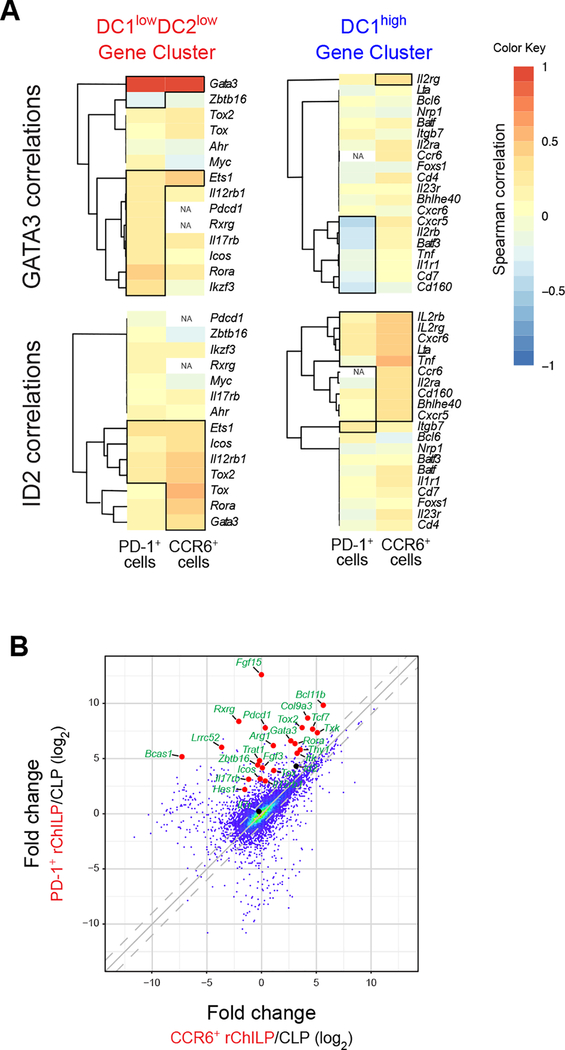
Figure 6. GATA3 Expression is Positively or Negatively Associated with the Expression of Lineage-Related Genes that Belong to PD-1- or CCR6-Expressing ILC Progenitors, Respectively.
(A) The PD-1+ cells (non-LTi ILC progenitors) and CCR6+ cells (LTi progenitors) were defined as in Figure S6A, and non-LTi ILC lineage related genes (DC1lowDC2low Gene Cluster) and LTi lineage related genes (DC1high Gene Cluster) were defined as in Figure S6B. The correlation (Spearman) between the expression of GATA3 (upper panel) or Id2 (lower panel) and these lineage related genes were analyzed within the two progenitor populations. All pairs with correlation p values < 0.05 are boxed in the heatmap. NA, not applicable because of very low or no expression of this gene.
(B) The distinct ILC progenitors within the rChILP population were isolated by cell sorting (non-LTi ILC progenitor = Lin−CD127+Flt-3-T1/ST2−α4β7+c-Kit+PD-1+CCR6−, and LTi progenitor = Lin−CD127+Flt-3−T1/ST2−α4β7+c-Kit+PD-1−CCR6+), and they were then subjected to bulk RNA-Seq analysis. The gene expression of these two ILC progenitors was then compared using the CLPs as a reference.
Data are pooled from two independent experiments (A) or from two biological duplicates (B).
See also Figure S6.

