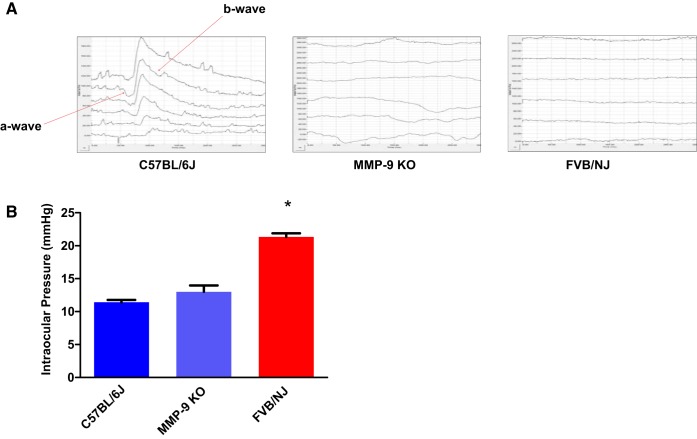
Fig. 5.
Recordings of the electroretinogram (ERG) and the intraocular pressure (IOP) in mice strains. ERGs were recorded in response to 0.47 log cd·s/m2 strobe flashes presented under dark-adapted recording conditions. In comparison with C57BL/6J response, the a- and b-wave components (red arrows) were either markedly reduced in MMP-9 KO or completely missing in the FVB/NJ mouse strain, indicating altered electrical responses in their respective retinae (A). IOP measurements show enhanced pressure recording in FVB/NJ in comparison with the MMP-9 KO and C57BL/6J mice strains, *P < 0.0001 when compared with C57BL/6J (B).

