
Fig. 2.
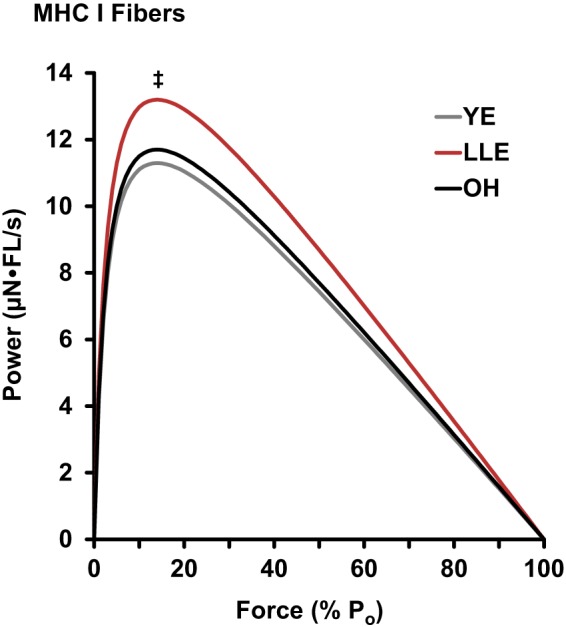
Mean power curves [µN·fiber length (FL)/s] of myosin heavy chain (MHC) I fibers for young exercisers (YE), lifelong exercisers (LLE), and old healthy nonexercisers (OH). Statistical analysis was conducted on the values for peak power (Po). Significant difference in these single values for specific groups: ‡P < 0.05 vs. YE.