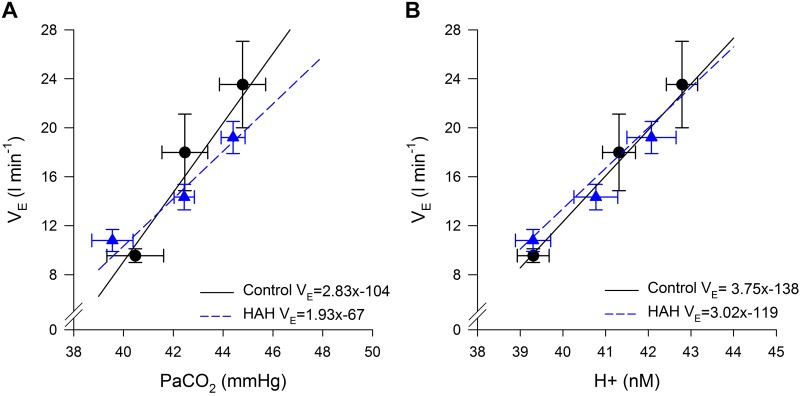
Fig. 5.
Ventilatory response to altered levels of carbon dioxide. A: average slope and intercept was 2.83 ± 0.46 L·min−1·mmHg−1 and −104 ± 19 L/min for controls and 1.94 ± 0.31 L·min−1·mmHg−1and −67 ± 13 L/min for high-affinity hemoglobin (HAH). B: average slope and intercept was 3.75 ± 0.63 L·min−1·mmHg−1and −138 ± 25 L/min for controls and 3.30 ± 0. L·min−1·mmHg−1 and −119 ± 23 L/min for HAH. V̇e, ventilation; , arterial carbon dioxide tension; H+, hydrogen ion concentration.

