
Fig. 3.
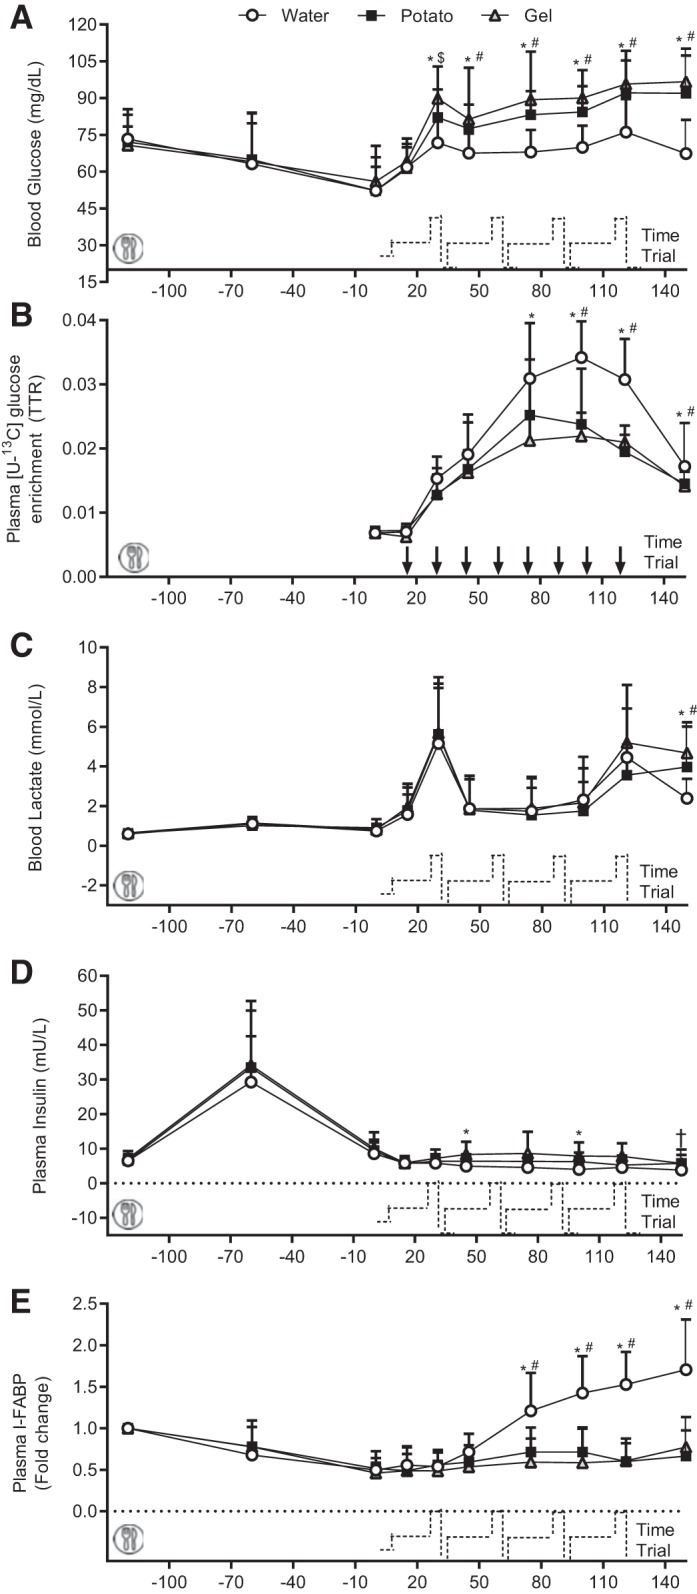
Blood glucose (A), blood lactate (B), plasma [U-13C]glucose enrichment (C), plasma insulin concentrations (D), and fold change from baseline of plasma intestinal fatty acid-binding protein (I-FABP) concentrations (E) during the experimental trial. All values are presented as means ± SD (n = 12). A standardized breakfast was consumed at −120 min. TTR, tracer ([U-13C]glucose)-to-tracee (glucose) ratio. *Significant difference between water and gel (P < 0.05); #significant difference between water and potato (P < 0.05); †tendency toward difference between water and gel (P < 0.10); $tendency toward difference between water and potato (P < 0.10).