
Figure 3.
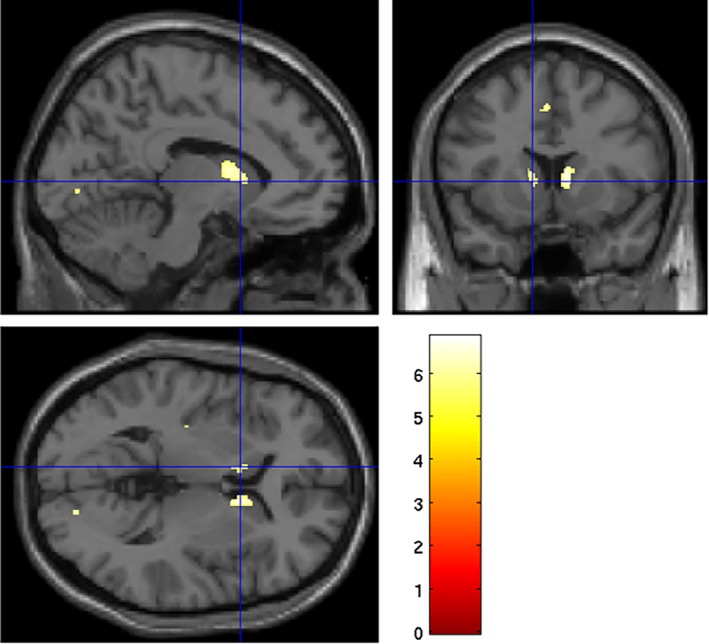
Areas where quantitative T2 is higher (lower iron content) in Huntington's disease gene carriers when compared with controls. Family‐wise error–corrected threshold of P < 0.05. Overlaid on a standard Montreal Neurological Institute (MNI) template.