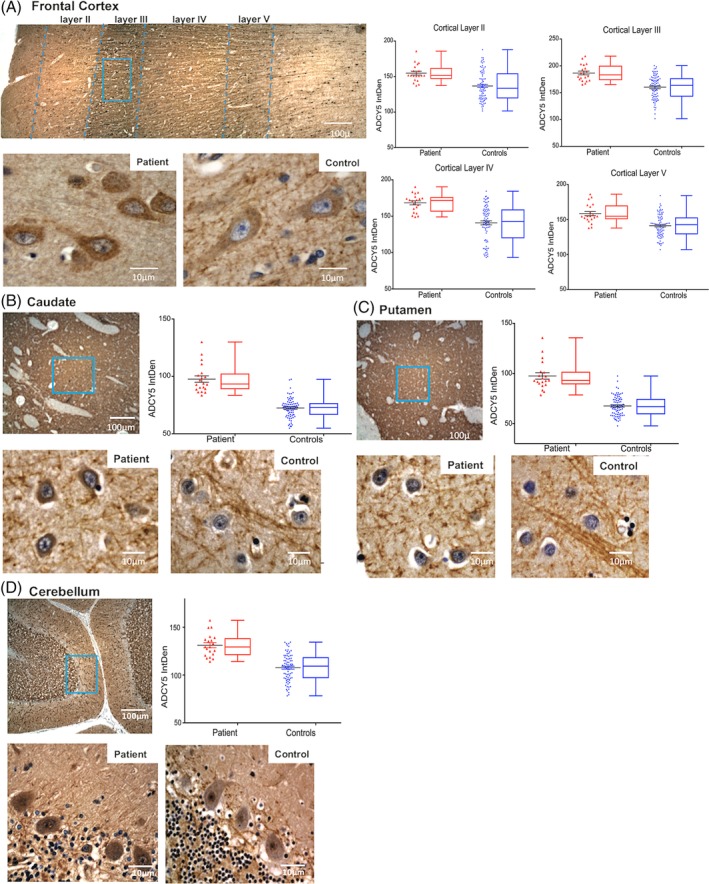
Figure 4.

Quantitative assessment of ADCY5 staining intensity in multiple brain regions in the patient with ADCY5‐dyskinesia. DAB chromogen IHC staining for ADCY5 in the patient and 4 age‐ and sex‐matched controls. In panel (A), the top image is full thickness of gray matter in the frontal cortex from the patient showing layers I through VI. Below, the higher‐magnification images show representative sections from that area framed in blue from the patient (left) and a control (right) stained for ADCY5. Similarly, panels (B), (C), and (D) are caudate, putamen, and cerebellum, respectively. For each area, the scatter and box‐whiskers plots display quantitative measurements of the DAB chromogen intensity of ADCY5 in 20 randomly selected cells in each subject. Results from the patient (data from 20 cells) are labeled in red, and results from 4 controls (combined data from a total of 80 cells) are grouped and labeled in blue. The results demonstrate increased ADCY5 staining intensity in the patient in all brain regions studied.
