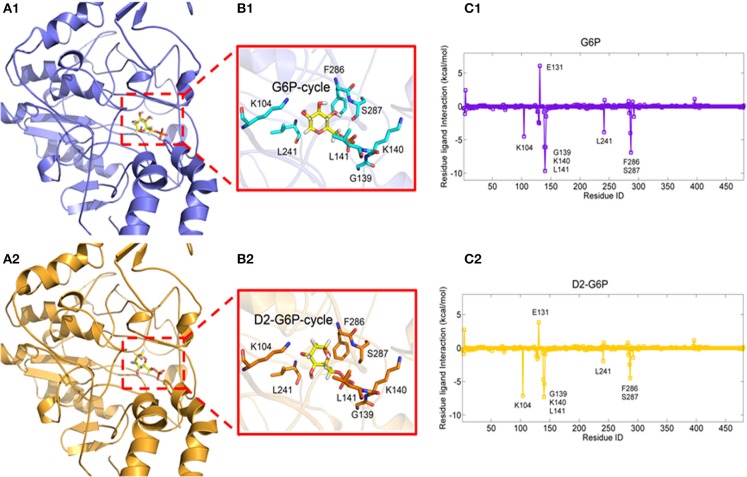
Figure 3.
Complexes of MondoA binding with G6P (A1, yellow stick model) and D2-G6P (A2, yellow stick model). The top contributing residues are derived from the corresponding residue-ligand interaction spectra (C1, C2, predicted by MM/GBSA energy decomposition) shown in the purple and orange stick models in B1, B2, respectively.

