Figure 1.

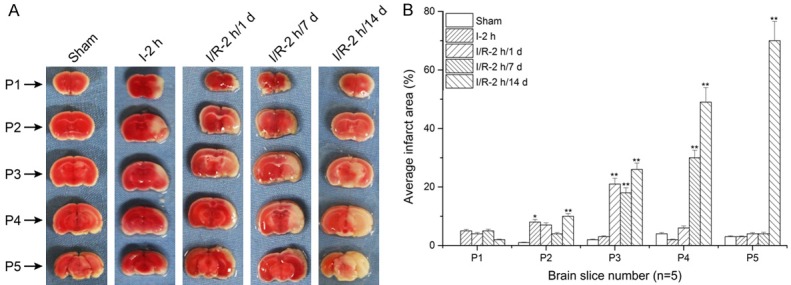
2,3,5-Triphenyl four azole nitrogen chloride (TTC) staining of rat brain tissue and histogram analysis. Images show that infarct size significantly increased in P2-P4 sections compared to P1 (*: P<0.05; **: P<0.01, compared to P1).

2,3,5-Triphenyl four azole nitrogen chloride (TTC) staining of rat brain tissue and histogram analysis. Images show that infarct size significantly increased in P2-P4 sections compared to P1 (*: P<0.05; **: P<0.01, compared to P1).