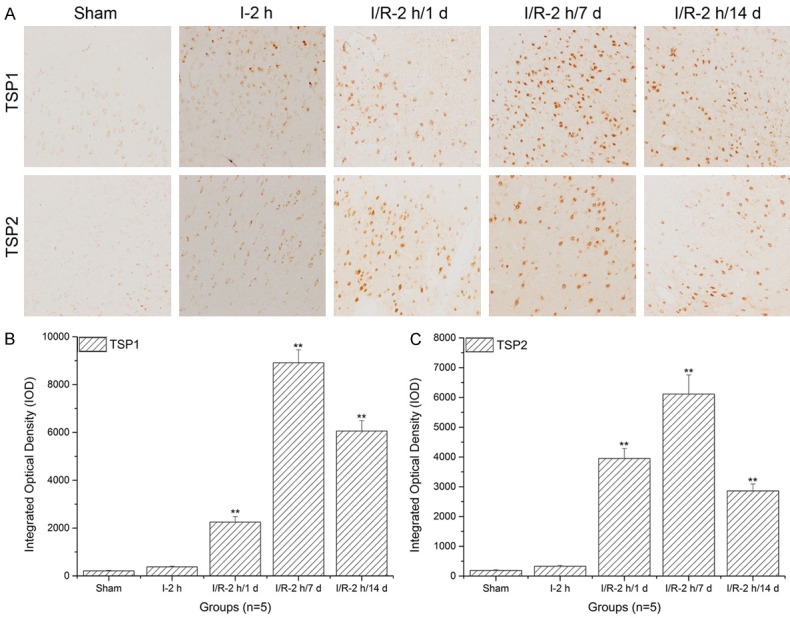
Figure 5.

Thrombospondin (TSP)-1 and TSP-2 expression level assays in the piriform cortex using immunohistochemistry and histogram analysis. A. The immunohistochemistry assays of TSP-1 and TSP-2 in the piriform cortex; B. Histogram analysis of TSP-1 expression levels in the piriform cortex; C. Histogram analysis of TSP-2 expression levels in the piriform cortex. Images indicate that the TSP-1/TSP-2 expression levels in the piriform cortex significantly increased with increasing reperfusion times (**: P<0.01, compared to sham).
