
Figure 2.
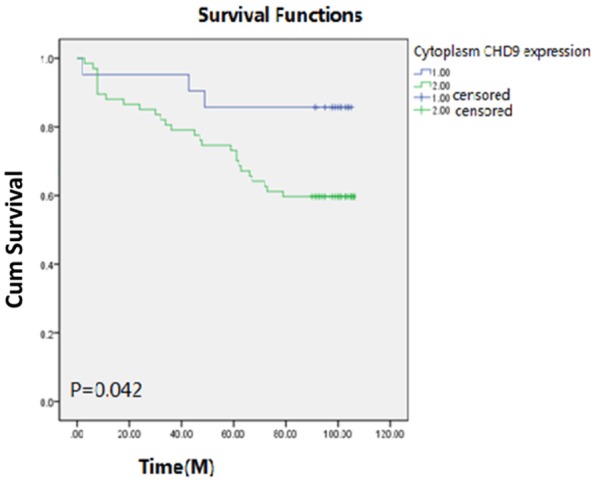
The relationships between the overall survival time of ccRCC patients and CHD9 expression: 1.00 represents the patients with low cytoplasm CHD9 expression; 2.00 represents the patients with high cytoplasm CHD9 expression.
Official websites use .gov
A
.gov website belongs to an official
government organization in the United States.
Secure .gov websites use HTTPS
A lock (
) or https:// means you've safely
connected to the .gov website. Share sensitive
information only on official, secure websites.
The relationships between the overall survival time of ccRCC patients and CHD9 expression: 1.00 represents the patients with low cytoplasm CHD9 expression; 2.00 represents the patients with high cytoplasm CHD9 expression.