
Figure 5.
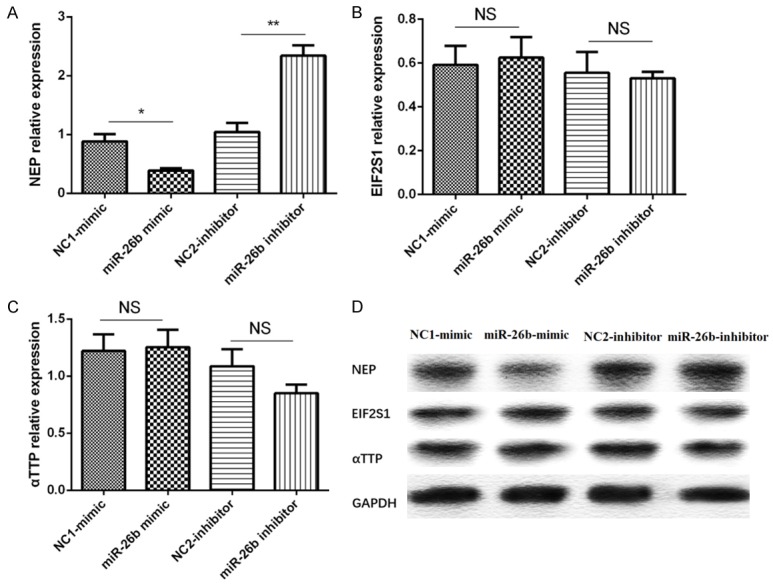
Effect of miR-26b levels on NEP, EIF2S1, αTTP genes. A. The expression of NEP mRNA in different groups. B. The expression of EIF2S1 mRNA in different groups. C. The expression of αTTP mRNA in different groups. D. The expression of NEP, EIF2S1, αTTP protein in different groups. Comparison between two groups was determined by t test. P<0.05 was considered significant. *P<0.05, **P<0.01, ***P<0.001.