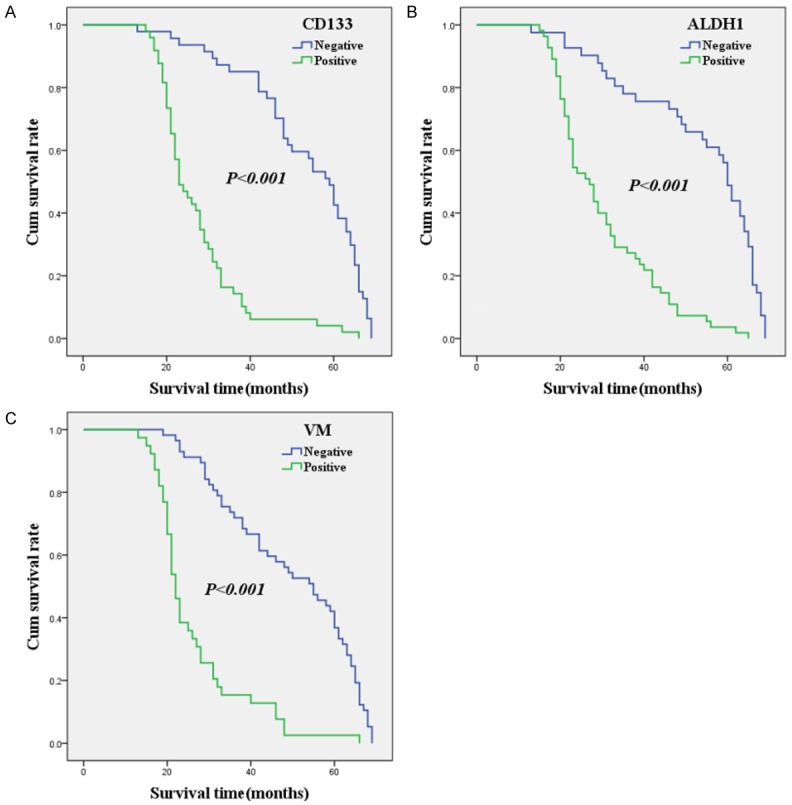
Figure 2.

Kaplan-Meier analysis of the survival rate of patients with osteosarcoma. The y-axis represents the percentage of patients; the x-axis, their survival in months. (A) Overall survival of all patients in relation to CD133 (log-rank =56.392, P<0.001); (B) Overall survival of all patients in relation to ALDH1 expression (log-rank =45.990, P<0.001); (C) Overall survival of all patients in relation to VM (log-rank =48.472, P<0.001); In the (A-C) analyses, the green line represents patients with positive CD133, or ALDH1, or VM, and the blue line represents the negative CD133, or ALDH1, or VM patients.
