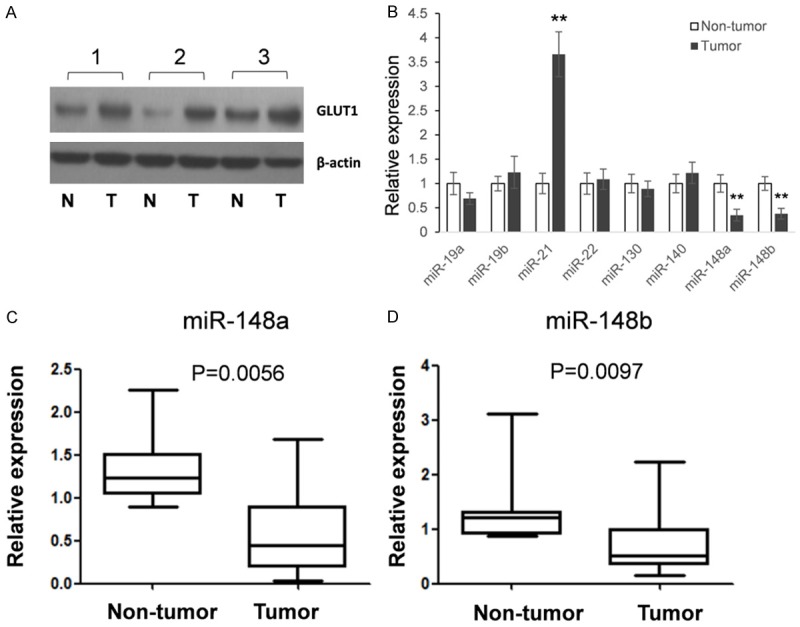
Figure 1.

the expression of GLUT1 and eight selected miRNAs in PC patients. A: An example of GLUT1 expression in PC tissues and adjacent non-tumor tissues. B: The expression of eight miRNAs was detected by qRT-PCR. Tissue from thirty-three patients were randomly divided into eleven groups with three RNA samples were mixed. Stem-loop qRT-PCR was used to detect eight selected miRNAs expression. C, D: The expressions of miR-148a and miR-148b were detected by qRT-PCR in each tissue samples. The results were analyzed by student t-test and P<0.05 were considered statistically significant. *P<0.05, **P<0.01.
