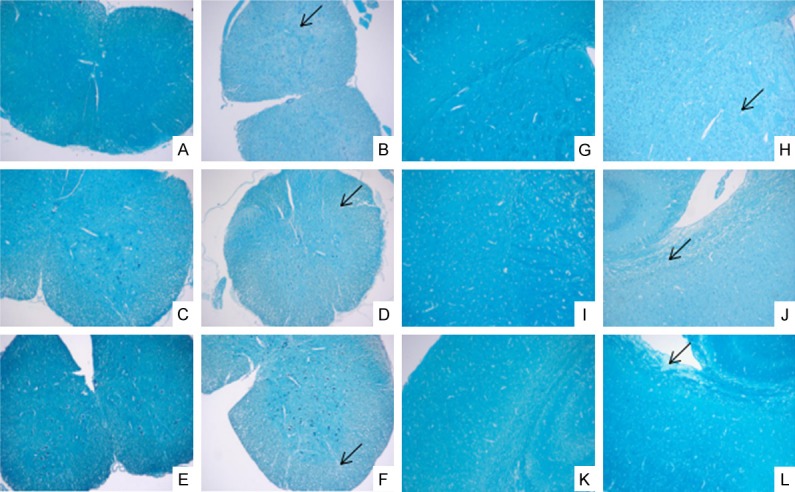
Figure 3.

LFB staining of brain and spinal cord on the 7th day, the 18th day and the 30th day (×100). A, G: The control group on day 7; B, H: The EAE group on day 7; C, I: The control group on day 18; D, J: The EAE group on day 18; E, K: The control group on day 30; F, L: The EAE group on day 30; A-F: The spinal cord; G-L: The brain; ↙: Demyelination.
