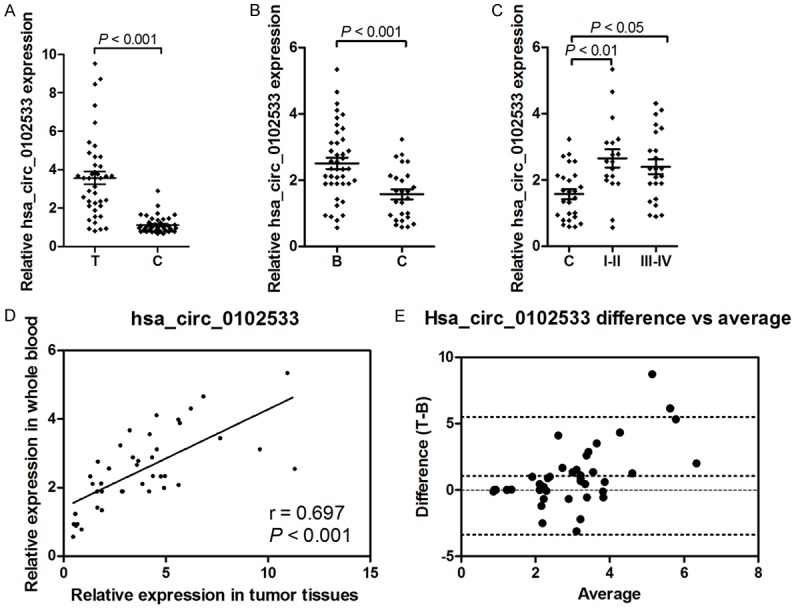
Figure 2.

The expression of hsa_circ_0102533 was verified by RT-qPCR in tumor tissues and whole blood from NSCLC patients. The expression of hsa_circ_0102533 was measured by RT-qPCR in forty-one pairs of NSCLC tumor tissues and corresponding nontumorous tissues (A), as well as in the whole blood from forty-one NSCLC patients and twenty-six healthy controls (B). The expression of hsa_circ_0102533 was measured by RT-qPCR in twenty-six healthy controls, eighteen stage I-II and twenty-three stage III-IV NSCLC patients (C). Spearman’s rank analysis was used to identify the correlation of hsa_circ_0102533 expression between tumor tissues and whole blood from NSCLC patients (D). A Bland-Altman agreement analysis showed the mean difference of hsa_circ_0102533 expression between whole blood and tumor tissues (E).
