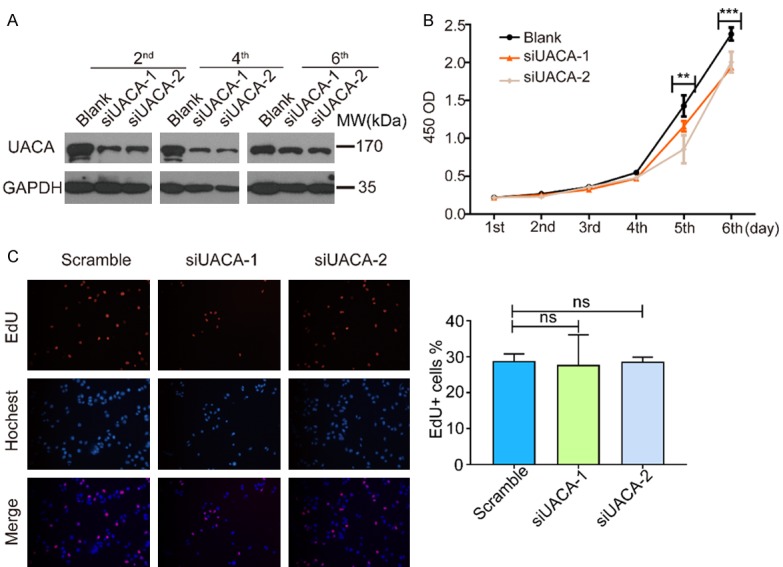
Figure 2.

Knockdown of UACA leads to decrease in proliferation but not EdU-positive ratio in HCC cells. A. SK-Hep1 cells were transfected with UACA siRNA. After the indicated period of time, the cells were lysed and western blot was used to detect the level of UACA. GADPH was used as the internal control. B. CCK-8 assay was carried out on SK-Hep1 cells from the same batch with panel. Data was collected from three independent experiments. Two-way ANOVA was used to compare the OD values among three groups. **P < 0.01, ***P < 0.001. C. SK-Hep1 cells were transfected with siRNA-UACA and EdU assay was performed. Representative images are shown. The quantification was shown on the right. At least 10 fields were counted and the average EdU+% from three independent experiments were used for statistical analysis. One-way ANOVA and then Dunnett’s multiple comparisons test was used to do the comparison among the three groups and between two groups. ns, not significant.
